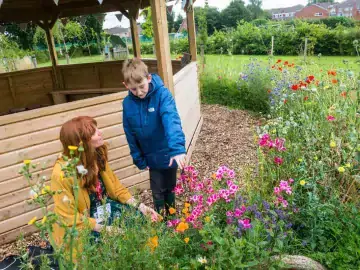
Biodiversity bar charts

This activity is designed to be used as a starter to help children and young people quickly collect and visualise data, to make conclusions about what living things can be found within their learning site. Framed as a creative activity, this allows learners to describe and visualise the data points they have collected about their site, and work together to build a bar chart – which can help identify opportunities to develop your Nature Park. 

< 30 minutes
KS2-4

Preparation

What you need
  • A selection of colour paper or card – if not available, ask learners to colour a small circle or symbol on their piece of paper to help colour code 
  • A hole punch 
  • A small whiteboard or flipchart paper for your key 
  • Treasury tags or string 
  • Pencils 
  • Clipboards, one per person 
Location

Outdoors

Useful guidance
Resources

Step by step

  1. To prepare, you will need various coloured card cut into A6, with holes punched at the top and bottom to be hung up. Give each colour a different category (for example: Insects, Birds, Plants, Fungi, Mammals). Create a key for your colour categories with your learners and display this for your learners during the activity – this could be on a small whiteboard or flipchart paper. 
  2. Outside in your site, split learners into small groups and assign each group a part of the site to work on – this will help us capture data from the whole area! Ask learners to identify how many types of things they can find for each category in that area – each of these will become a card. (For example, in their ‘Plants’ category, learners may have found two different types of tree, two different types of flowering plants and one type of grass – so they will have five cards in the Plants category.) Try to encourage learners to notice what is different about the things they are finding outside. 
  3. Ask learners to draw or write on their piece of card to describe the living thing they are looking at in more detail. Their card could include: a drawing, a name for the living thing, a description of its features (what makes it similar or different from the other things in this category?), location it was found in, or any other interesting observations. 
  4. After the data collection, work together to create your bar chart. (This would work best back in the classroom to stop your work from flying away!) Using treasury tags or string, join all cards of the same colour category together to create a long strip. Why not attach or hang the strips on the wall to create a display of your findings? Alternatively, hang the cards randomly to see the biodiversity found on your site.  
  5. What do children and young people notice? What conclusions can be made about your site from the data collection?  

Reflection

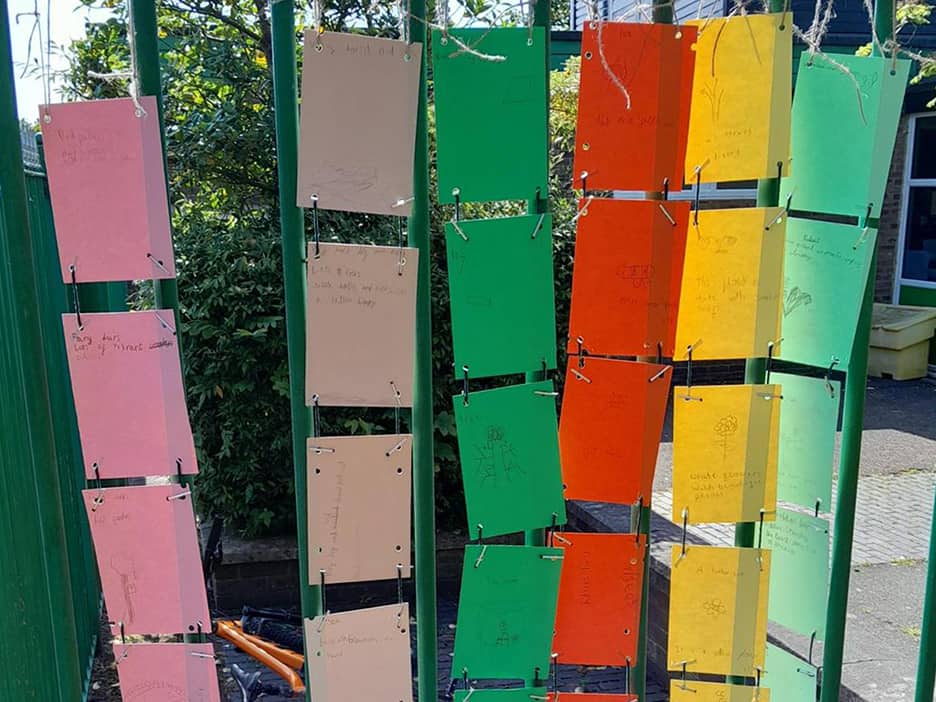
Looking at the collected data and the colourful cards, is there anything missing? Is there more of one thing than another? Why might that be? What would we like to change, or have more or less of?

Different colours of card arranged in a bar chart