Has your habitat map reached research grade?
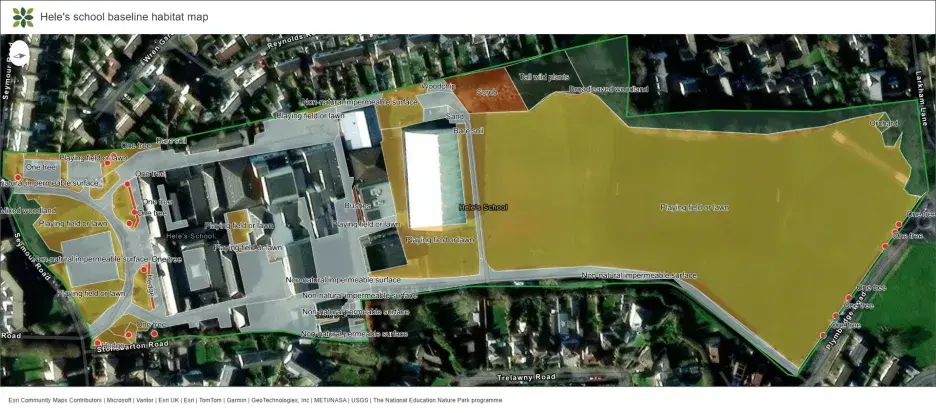
Mapping your habitats is a great way to explore your site - and it also means your learners are working alongside researchers at the Natural History Museum on real-world science.
We are beginning the first analysis of Nature Park habitat maps, using the data collected by young people across the country to estimate biodiversity. To be research grade and be included in Nature Park research, maps need to be at least 80% complete and of good quality.
Reviewing your map together in class will strengthen its accuracy and increase the chance of your work being part of our collective research and scientific journal paper. Use our handy checklist below to ensure your learners’ data is research grade quality!
You can edit your habitat maps by logging into the Nature Park website and launching the Habitat Mapper tool. If you need a refresher, check out our interactive digital tools how-to guide with lots of short videos.
Checklist
- Have you mapped all features within your site boundary (excluding buildings)?
Missing habitats in your outdoor space will lead to an underestimate of biodiversity. - Are there any overlapping shapes?
Edit any habitat areas that overlap - especially if they represent different habitats. Otherwise, we won’t know which habitat is correct and may have to exclude them. Top tip is to use the snapping tool: see below. - Is all habitat data complete?
For each feature, record both the habitat group e.g. “trees” and the habitat as “broadleaved woodland”. This more detailed information improves our biodiversity estimates. Are there any lines drawn instead of an area?
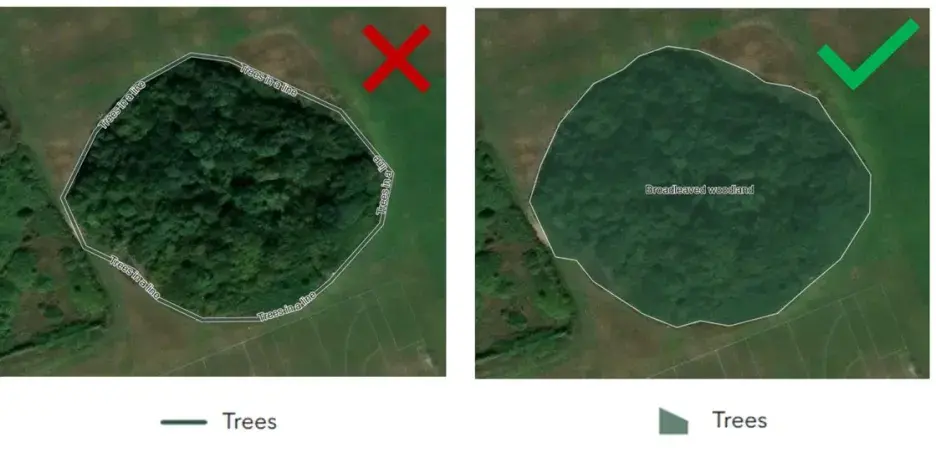
Certain habitats should be mapped as areas (an area of trees or an area of ground without plants), others as lines (a hedge). Take a moment to check yours are in the right format. If you’re unsure which to use, revisit the habitat mapping activities.For example, this woodland should be mapped as an area of trees, not a line of trees, so make sure you select the right type of "Trees" from the list of points, lines and areas. See the slight change in colour when an area is drawn - it means everything under that shape will be counted.
Tips and tricks
- Use the flowcharts to identify your habitats.
- Draw habitat areas first, then lines, then points - think of it like icing a cake: first you add a flat layer of icing (areas), then you add the ribbons (lines), then the spot additions (points). This way, lines and points will sit clearly on top of the area.
- A tip to remove gaps and avoid overlapping habitats: as soon as you open Habitat Mapping, turn on the snapping tool! See video.
Turning on the snapping tool
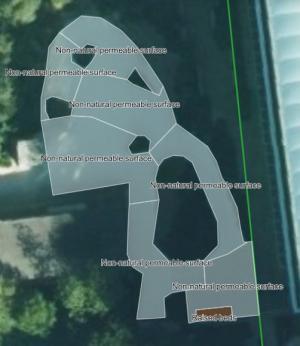
- When drawing areas, avoid crossing over the outlining lines, as this makes shapes that are difficult to analyse. It’s often simpler to break a large area into several smaller shapes, like puzzle pieces!
What’s next?
Once your baseline habitat map is complete, look at the Nature Park Map to explore your data and others across the country. This can help your learners identify opportunities and make decisions about the best changes on your site for nature and for people.
If you have already made improvements, record them using the Tracking Change tool, to see the positive difference your actions have made and add to Nature Park scientific research into improving grounds for nature.