Image
Use this dataset compiled by iNaturalist users to explore associations between invertebrates and plants.
Learners can start working with data to answer questions and practise key skills in Science, Maths, and critical thinking. Learners can also use this data as a starting point for planning how they might do more scientific bug catching.
Indoors
This dataset compiles observations from iNaturalist that use the 'Perching on' field, which indicates the species an organism was standing on or nearby.
The main organisms were mostly collected using a sweep net or a beating tray. These methods are excellent for gathering small, easily missed animals. However, because the animals were observed post-collection, we don't know for certain what the animal was doing on the plant.
Many of the collected animals are difficult or impossible to identify to species-level from photos alone. Some species require microscopic inspection, dissection, or genetic analysis to identify with confidence. Often there are only a few specialists who study these smaller invertebrates, and even fewer who dedicate time to iNaturalist identifications. ‘Research grade’ observations have been identified to species-level by at least 2 users.
Fortunately, identifying small animals to broader taxonomic groups is much easier. Therefore, the dataset also provides the scientific family and order level identifications for each observation. Learners might find that translating these into their common names provides them with useful information about the animals’ physical features or behaviour. For example, the common name for Araneidae is orb-weaving spiders because they spin orb-shaped spider webs.
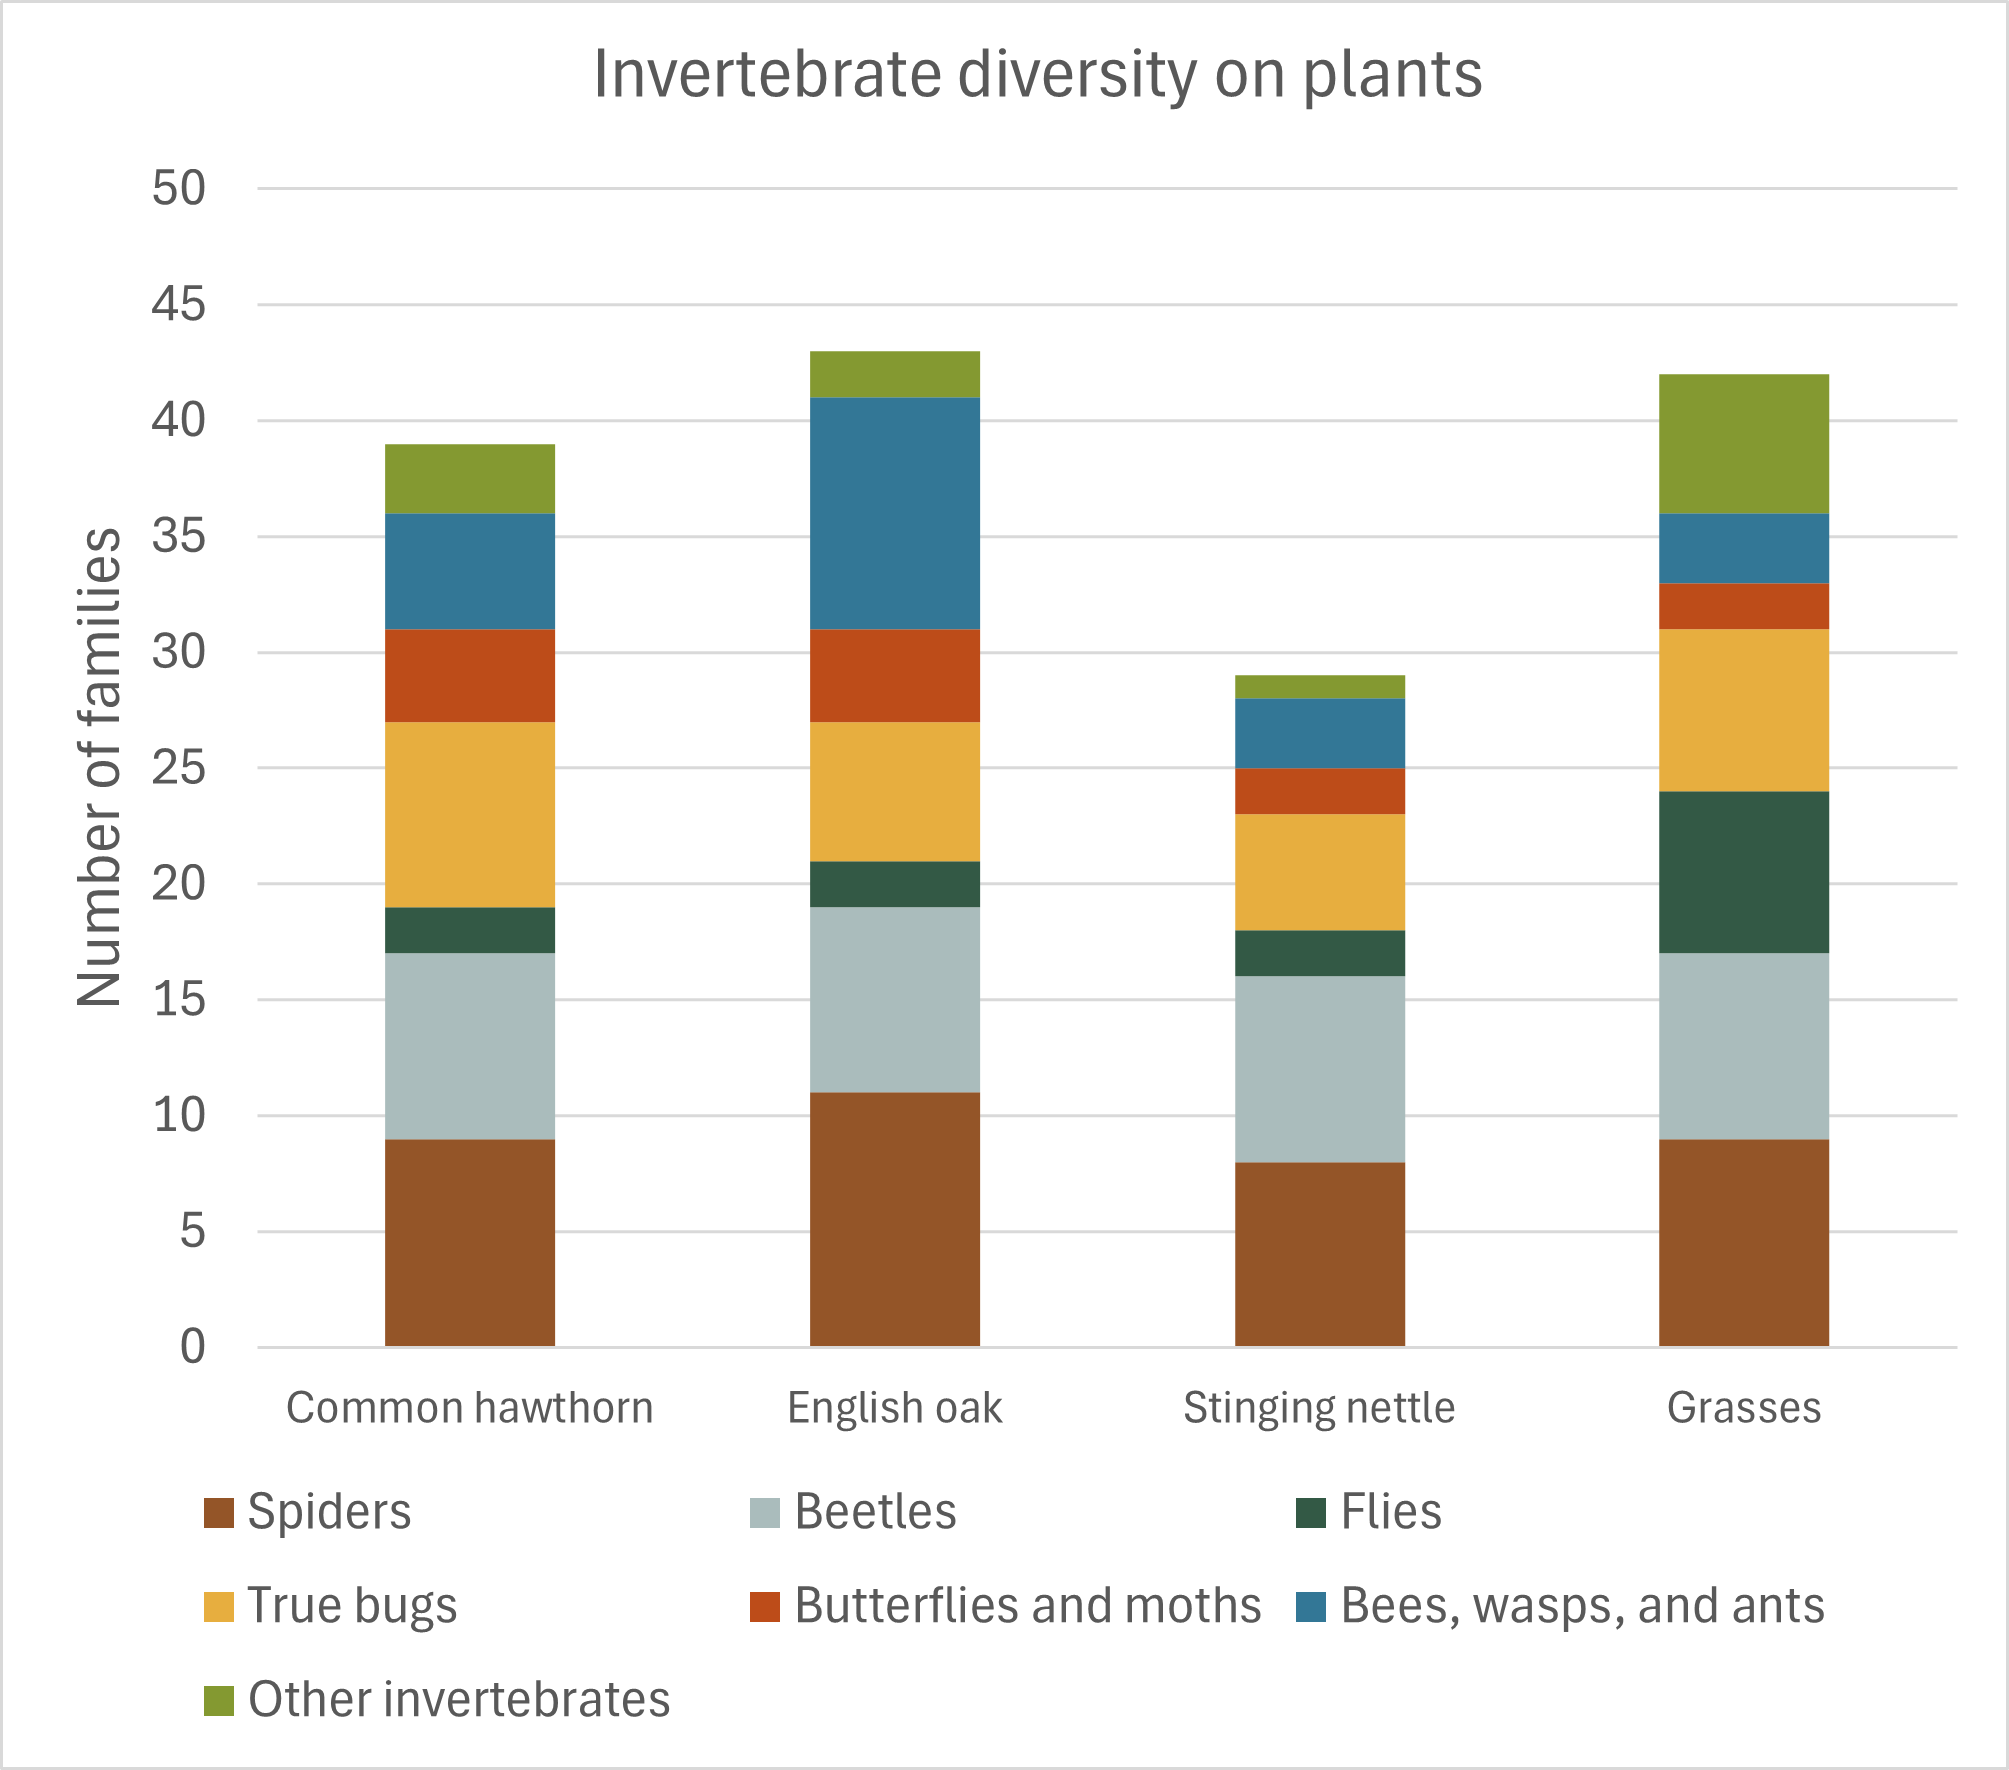
Compare the number of invertebrate families that were caught perching on different plants. Do some plants host more biodiversity than others?
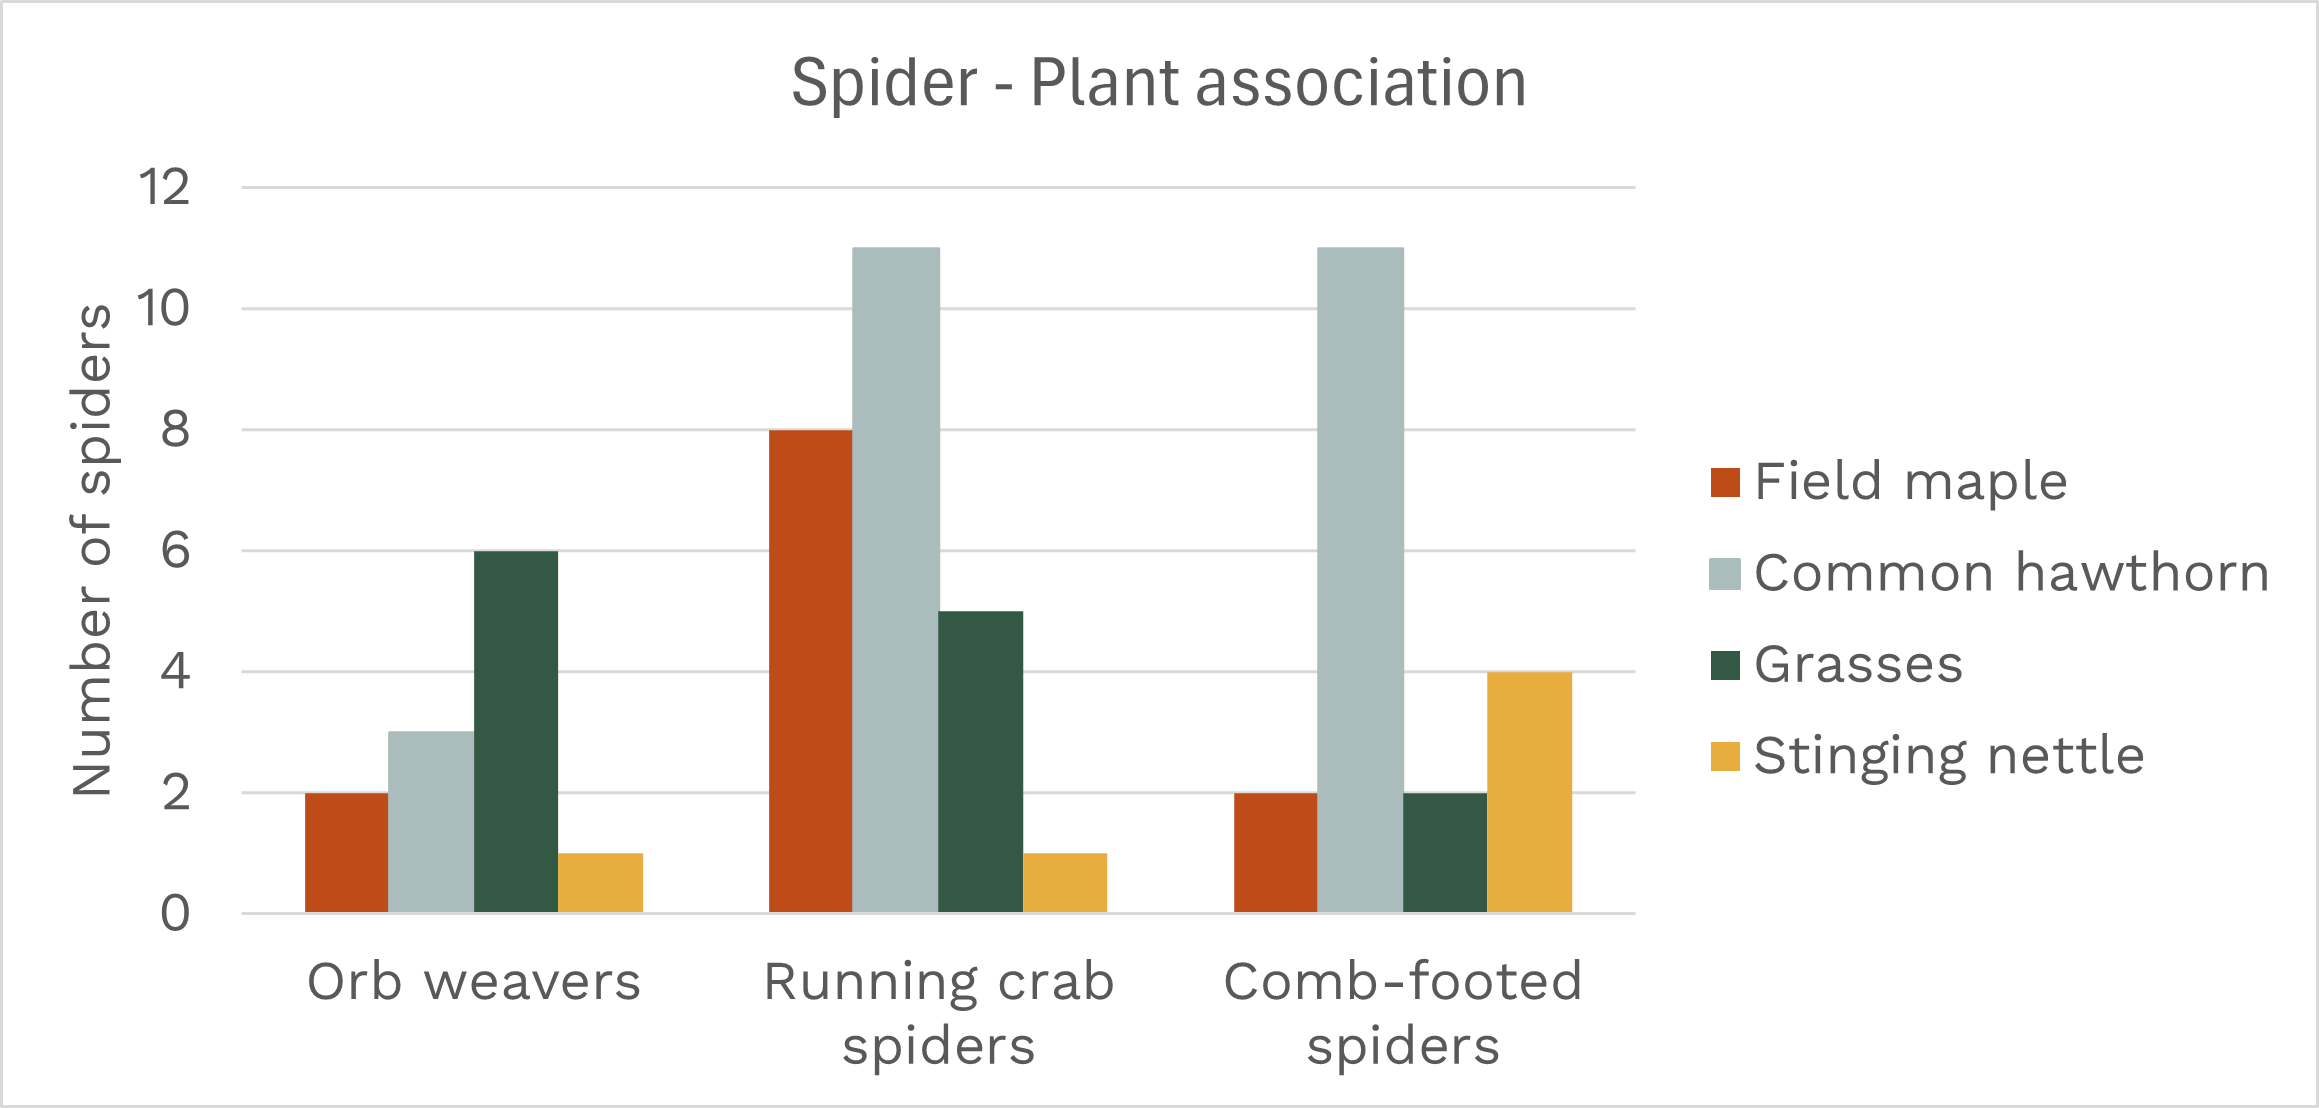
Compare the plants perched on by a species, family, or order. Do invertebrates have preferences for particular plants?
Is there bias in the data that needs to be managed?
It isn’t clear how systematic these records are. It is unlikely that every individual animal was recorded from each sweep, as we would expect many more very small animals like springtails. There is likely a bias towards larger animals and those which cannot fly out of the sweep net or beating tray.
Is it possible to infer reasons for the associations (or lack thereof) observed in the data?
Even though we can't know exactly what animals were doing when they were collected from the plants, the data may still reveal meaningful associations. For instance, an animal's ability to fly or climb might explain why it is associated with shrubs or trees instead of grass. These kinds of predictions can form the basis for further study prove or disprove our inferences.